Interpreting an ECG
The ECG graph displays voltage over time.
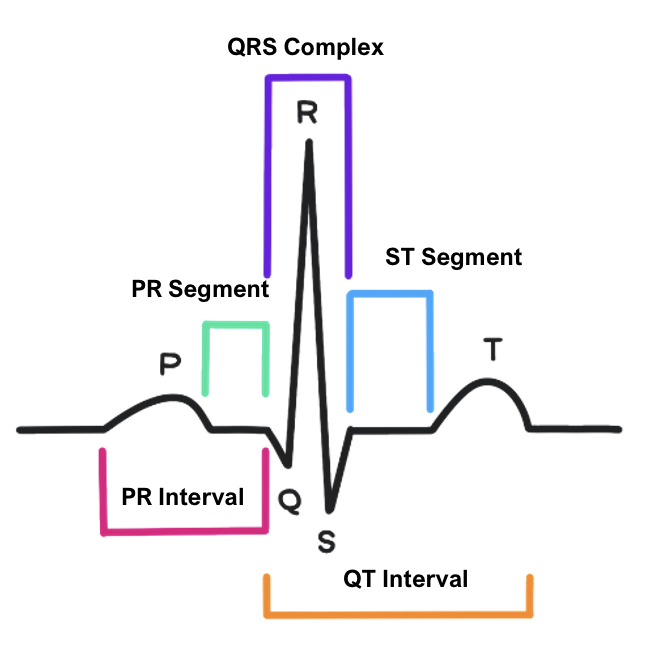
x- axis = time.
Length in 25mm/s and shows recording over 10s
Each small box is 0.04s, and large box = 0.2s
y-axis = voltage, measured in mV
Interval = the time taken from start of one wave to end of another
Segment = the time taken from end of one wave to start of another
When you are presented with an ECG, there are several things to assess in order:
1) Check patient details
Name
Age
Hospital number
ECG date
2) Rate
The strip at the bottom records electrical activity for 10 seconds.
Therefore, count the QRS complexes along the rhythm strip and multiply by 6.
3) Rhythm
The regularity can be checked using the paper-and-pen method on the rhythm strip.
Place a paper over the ECG trace.
Mark the position of two consecutive QRS complexes, marking the R/R interval.
Move the paper along the strip and check whether the R/R interval is the same.
If the rhythm is abnormal, it can be regularly irregular or irregularly irregular.
4) Axis
The axis is one of the most useful features that an ECG can tell you. Normal axis = -30º to +90º
As leads I-III and the augmented leads provide a complete frontal view of the heart, the net positive deflection of the current can indicate which axis the heart is aligned on.
There are two main ways of working out the axis:
Quadrant method
To quickly calculate the axis, you use the quadrant method – look at lead I + aVF.
Under normal circumstances, due to the way that these leads follow the current, the QRS deflections in both these leads should be positive.
This shows that in ventricular contraction, the main direction of the depolarisation is pointing downwards and to the left (following normal anatomy of heart)
However, if the heart undergoes hypertrophy on either side, this can alter the axis.
Therefore, this can be used to give a crude (qualitative) measure of the overall axis of the heart.
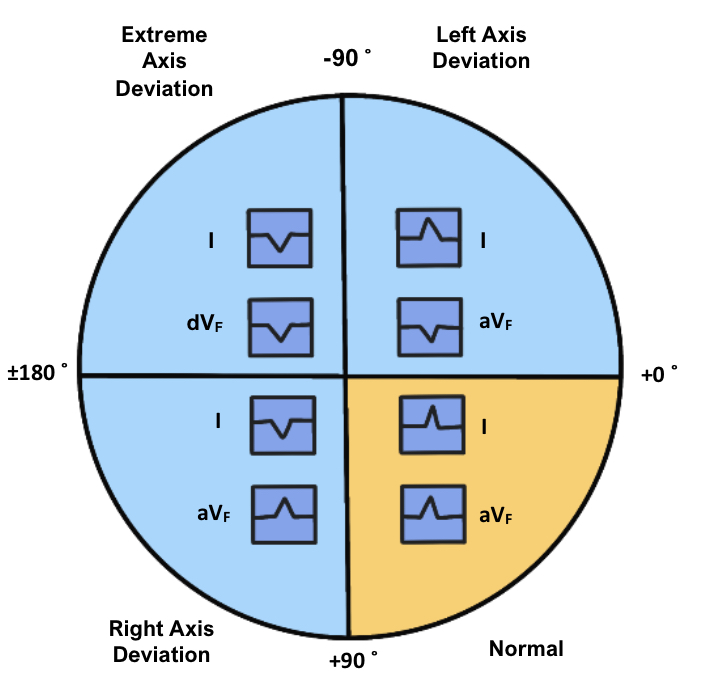
| Lead I QRS deflection | aVf QRS deflection | Axis |
| Positive | Positive | Normal |
| Negative | Positive | Right Axis Deviation |
| Positive | Negative | Left Axis Deviation |
| Negative | Negative | Extreme Axis Deviation |
Degree method
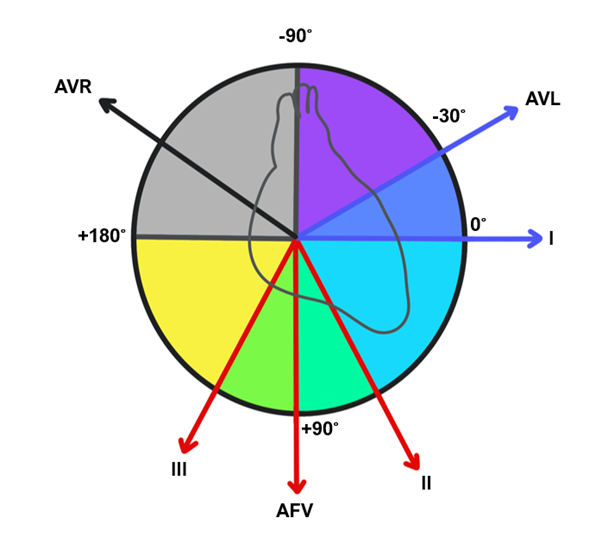
Another way to calculate the axis is to look at the limb and augmented leads
The axis lies at 90 degrees to the direction of the lead in which the isoelectric (equally positive and negative) QRS complex is found.
Find the lead with the smallest QRS complex.
Once you have done that, using the diagram find the lead with the axis perpendicular to it (e.g. if smallest QRS is lead I, look at lead aVF)
Look at that lead and note whether QRS is positive or negative
If the deflection of the QRS segment aligns with the direction is should be, then read off the axis in degrees using the diagram. If in wrong direction, add 180º to the value.
Causes of Axis Deviation
Problems which cause left axis-deviation:
Left-anterior hemiblock
Left ventricular hypertrophy
Inferior heart attack
Wolff-Parkinson White syndrome (WPW)
Problems causing right-axis deviation:
Left-posterior hemiblock
Right ventricular hypertrophy (e.g. after PE)
Anterolateral Myocardial infarction
Wolff-Parkinson White syndrome (WPW)
5) Examine distinct parts of the ECG waveform
P-wave
This wave signals the electrical activity flowing through the atria and should precede each QRS complex.
It is usually a positive deflection in leads II and III but is inverted in aVR.
Absent P waves are seen in atrial fibrillation and atrial flutter (although atrial activity is seen as regular “pseudo” P waves at a rate of around 300/min).
PR interval
This interval is the electrical activity passing from the atria to the ventricles.
The normal range 0.12–0.20 seconds.
Prolongation of the PR interval suggests that there is a delay in conduction between atria and ventricles, e.g., 1st/2nd degree heart block, digoxin and hypokalaemia.
A short PR interval suggests very fast AV conduction down an accessory pathway, e.g., Wolff-Parkinson-White syndrome.
If the PR segment is depressed, this is associated with pericarditis.
QRS complex
This signals electrical activity through the ventricles. The normal duration is < 0.12 s.
Any positive deflection is an R wave.
After an R wave, any subsequent negative line is an S wave.
A negative deflection before an initial R wave is called a Q wave.
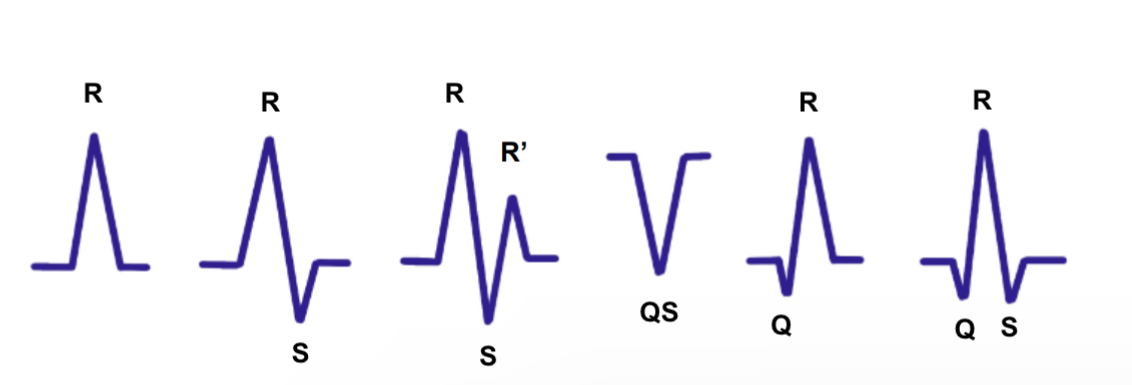
A broad QRS (> 0.12 s) means the ventricular rate is determined by a focus in the ventricles, e.g., bundle branch block, ventricular ectopic, hyperkalaemia.
A narrow QRS (< 0.12 s) means the ventricular rate is determined by a focus before the ventricles, e.g., SVT.
QT interval
This measures the time from the start of contraction to the end of relaxation and should be 0.38–0.42 seconds.
The corrected QT interval is QT interval divided by the square root of the R/R interval.
Prolongation of the QT interval can lead to ventricular fibrillation and sudden death.
A long QT interval is found in long QT syndrome, as well as secondary to hypocalcaemia, hypokalaemia and many drugs (e.g., SSRI, TCA).
ST segment
This is usually isoelectric. However, elevation or depression of the ST segment can be a sign of ischaemia to the heart.
The territories in which the ST elevation occurs can determine which part of the heart has an infarct.
T wave
This wave represents repolarisation of the ventricles. It can normally be inverted in aVR, V1 and sometimes V2. T wave inversion can be a sign of ischaemia in patients.
Peaked (tall) T waves are associated with hyperkalaemia.
Flattened T waves are associated with hypokalaemia.
Additional Waves
U wave
This wave represents the recovery of the Purkinje fibres and occurs after the T wave.
It is a positive rounded deflection, but it is usually not seen in a normal ECG trace.
Prominent U waves are seen in hypercalcaemia, hypokalaemia and digoxin toxicity.
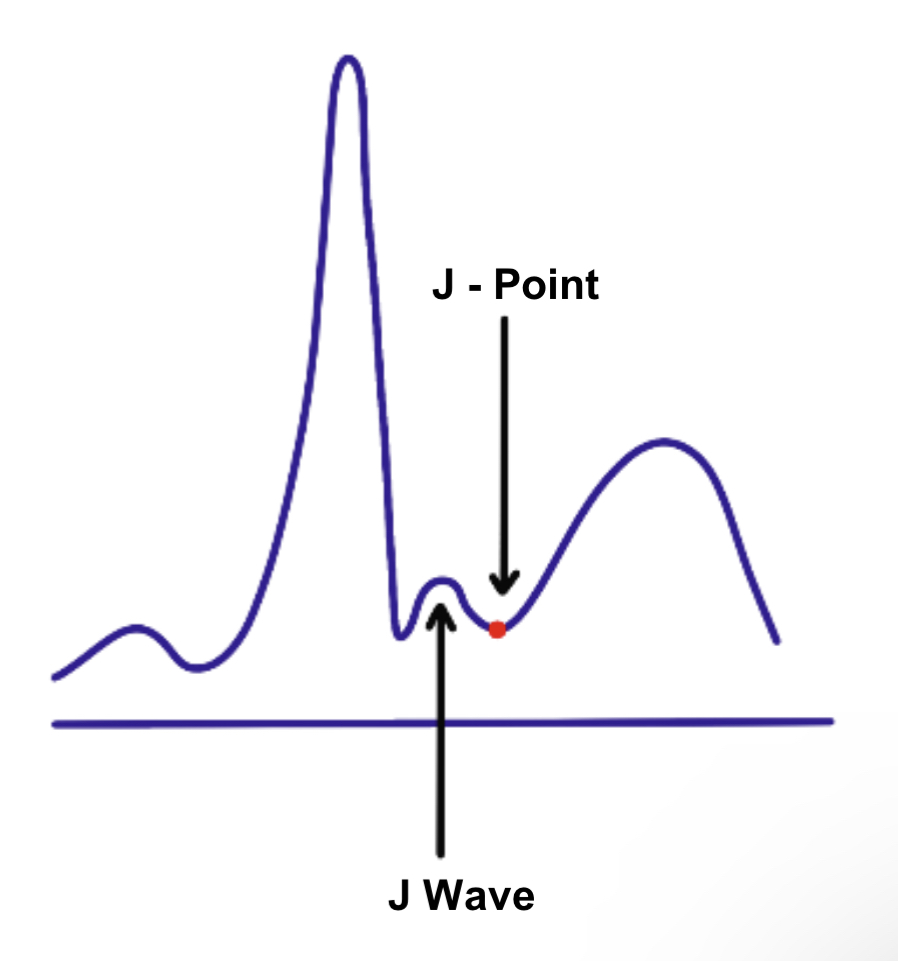
J wave
This is a notch in the point where the S wave finishes and the ST segment starts.
Again, it is not usually seen in a normal ECG trace.
Prominent J waves are seen in hypothermia and hypercalcaemia.
Disclaimer

